I’ll admit I meant to get this post out before February, but life got in the way (in a good way!)
There’s been a bit of Crypto-related news coverage recently, specifically on the approval of Bitcoin Spot ETF’s on Jan 10th. No matter your opinions on cryptocurrencies, the SEC approval is a big deal even if you have no intention of using these new products. Bitcoin is now more directly intertwined with our broader financial system, and it will have an effect on you in some form (“No effect” is also an effect)
I started thinking of strategies to make use of the Bitcoin spot ETF’s when the SEC twitter account mistakenly announced their approval a day prior to the public release.
One of the most popular trades to profit off of the SEC’s approval has been buying Grayscale Bitcoin Trust (GBTC) when it traded at a significant discount to the NAV of its Bitcoin holdings. This disparity occurred because GBTC acted as a closed-end fund prior to the SEC approval, meaning market makers couldn’t create or redeem GBTC shares like they would if it were an ETF, so GBTC’s value wasn’t pegged to Bitcoin’s. This trade was pure speculation on rumors of GBTC being converted into a spot Bitcoin ETF. In December 2022, GBTC’s discount to NAV was nearly 50%, and that gap has shrunk to near-zero following the Jan 10th conversion. So this opportunity is now off the table except under specific circumstances when GBTC’s price significantly deviates from NAV, which won’t happen often.
But with the number of new spot ETF’s, there are some exciting opportunities to take advantage of!
I analyzed several mean-reverting combinations of BTC spot products, and nearly all but the most popular ones have inadequate liquidity to run large-scale strategies. However, the pairs below look the most promising for smaller market participants looking to generate consistent, outsized returns via pair trading strategies:
- IBIT – BITO
- GBTC – IBIT
- GBTC – BITO
I backtested a simple medium frequency pairs trading strategy from Jan 11 to Feb 8th. For each pair, I used 5 minute OHLC data to find the pair’s “true” price (calculated using the relationship between the symbol’s most recent 5min close prices) relative to its realtime/ current price. Whenever the pair’s realtime price deviated from the “true” price by more than 3σ, a trade was entered at +/-3σ to buy (or short) the pair. The position was closed when the pair’s price returned to reflected the historical relationship between the two symbols.
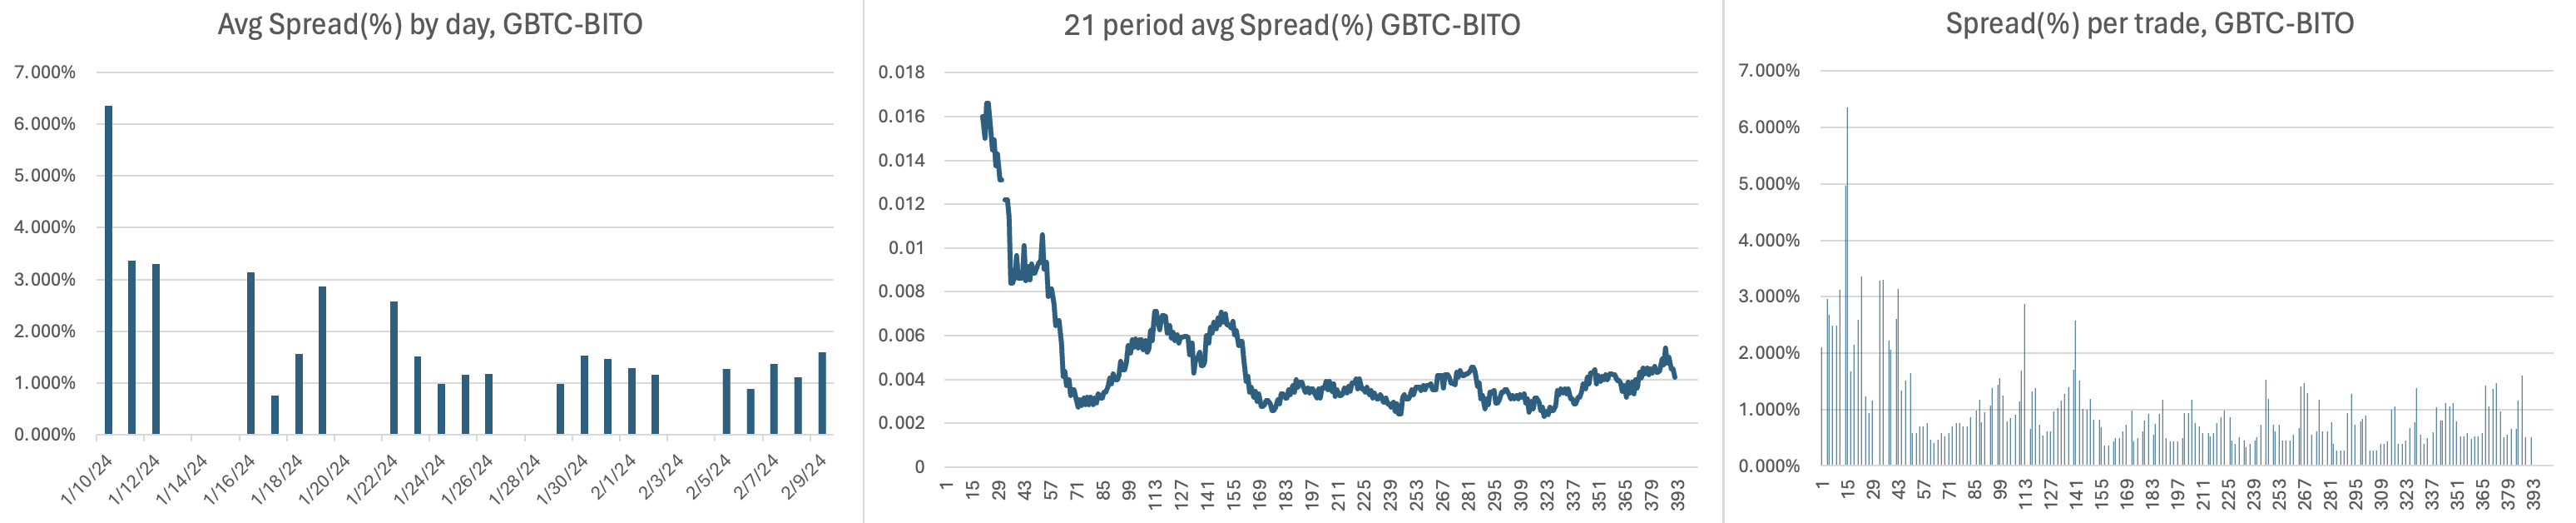
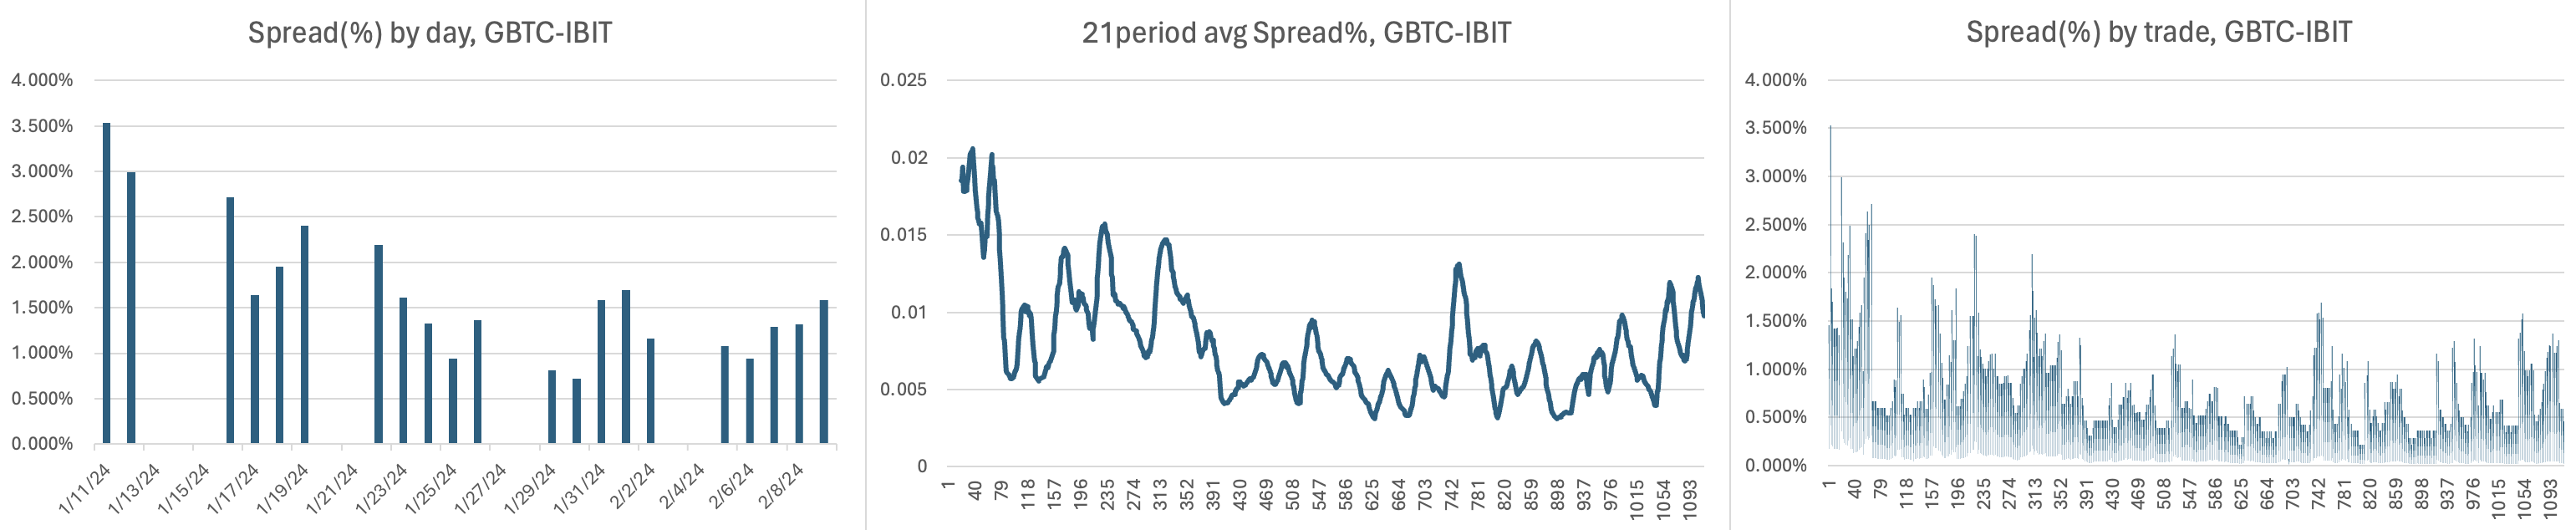

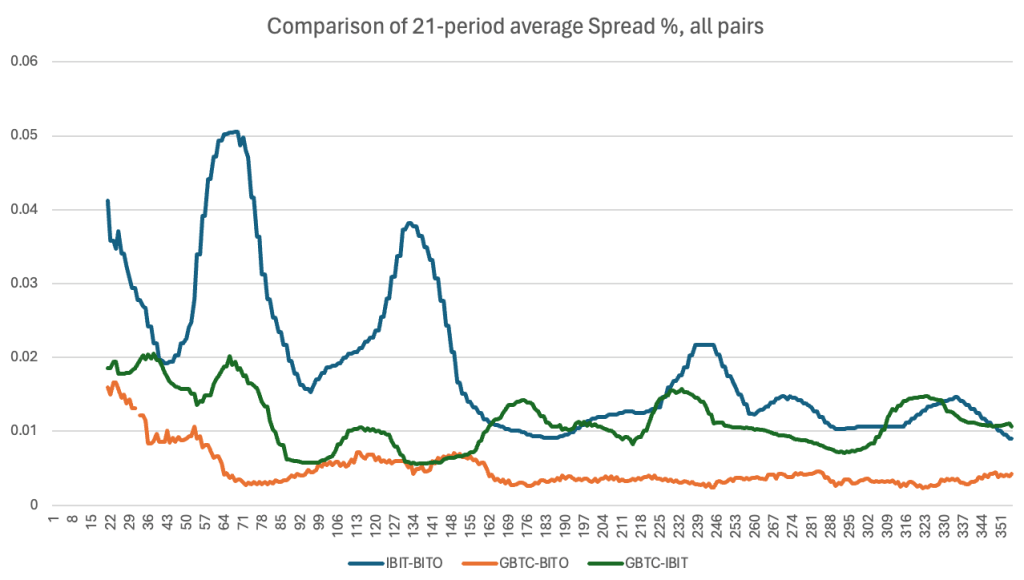
I will note that it looks like at least a few participants are running strategies on these pairs. This is supported by the fact that average spread sizes have been shrinking since the products started trading. This is typical of new products as they become more efficient, leading to a decrease in the number of stat-arb opportunities. If there’s an opportunity to make money, money will be made.
Increased morning volatility compared to midday volatility is shown nicely here – you can see that average spread sizes are larger at the open, then decrease throughout the day.
You can also see that after weekends & days off, spreads widen due to increased volatility. This can be attributed to the fact that these ETF’s do not trade over the weekend while Bitcoin & other cryptocurrencies trade 24/7, so BTC price moves over the weekend are only reflected in these ETF’s once the market opens on Monday.
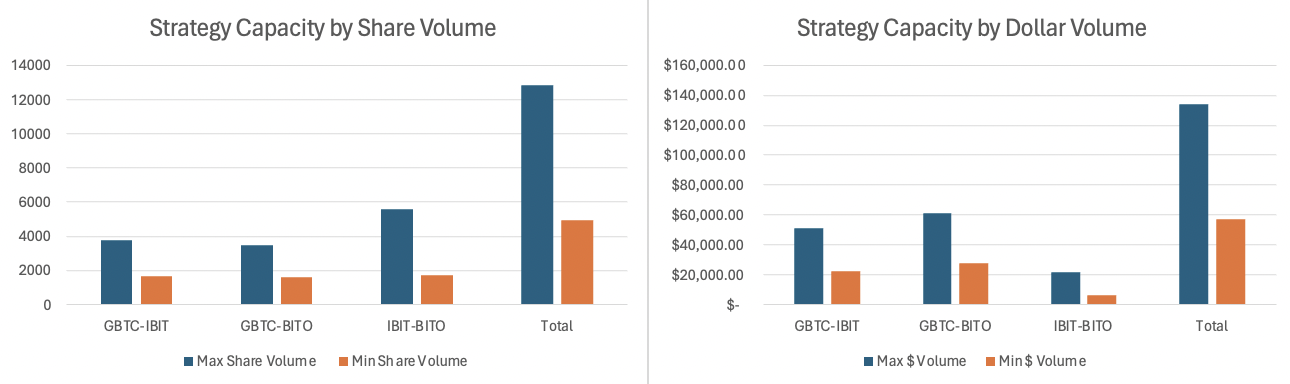
I also estimated the maximum capacity of these strategies and concluded that cumulatively, they are capable of supporting between 1,600 shares to 5,600 shares during the average 5 minute period. My estimate comes from the lowest 15th percentile of 5 minute volume and the 50th percentile of 5 minute volume since the products started trading, and then taking 5% of those values. In reality, the capacity of the strategy(ies) will fluctuate throughout the day with volume. A more reasonable estimate would be to assume a capacity of 0.25-2% of the average volume in a given 5 minute period. So this is a very rough estimate at best, and more tests would need to be done to improve this estimate’s accuracy.
The chart below shows the estimated minimum and maximum volume, per trade, of each strategy:

Leave a comment