This past month, I did an analysis for a client that showed some interesting, and in my opinion beautiful patterns in market behavior. The goal was to develop an understanding of the impact that premarket ranges have on intraday price movements, and come up with potential algorithmic strategies based on the findings.
In this post, I’ll be showcasing some patterns I found and giving some meaningful commentary. I really enjoy getting to deeply understand the intricacies of how things work – why things happen the way they do, what can explain certain behaviors and dynamics in our world, so this project was satisfying for me in that regard.
We’ll focus on three of the most popular ETFs: SPY, QQQ, and IWM, using price data from just the past few months. Showcasing the full analysis that covered ~2000 stocks over 20 years would be unfair to paying clients, but I got permission to share this study, which I think is still more than enough to appreciate the market’s elegance.
Before we get to the insights; I used 15 minute OHLC intraday + overnight price data from the past ~4 months. Volume was not taken into consideration. For each day, price data was cut into two segments: Overnight (PM/premarket: 4:00pm-9:30am) and regular market-hours (MH/market hours: 9:30am-4:00pm). For each part of the day, price movement was classified into one of the following categories using a convolutional neural network:
Overnight session (PM) (4:00pm-9:30am) Classifications:
- “R” – Range
- “U” – Uptrend
- “D” – Downtrend
Intraday Market Hours (MH) (9:30am-4:00pm) Classifications:
- “RR”: Remain in Range (Remain between premarket high & premarket low)
- “BOU”: Breakout Up (Break premarket high & significant follow through)
- “BOD”: Breakout Down (Break premarket low & significant follow through)
- “BUF” Break Up Fail (Break premarket high & no significant follow through)
- “BDF” Break Down Fail (Break premarket low & no significant follow through)
- “C”: Chop (Break both premarket levels, but no significant follow through in either direction)
*note: “significant follow-through” is defined as a move above or below the premarket level by a given percentage, which was defined for each symbol based on the average daily move. It does not mean that the stock remained above that level for the entire day; only that the level was breached by x%.
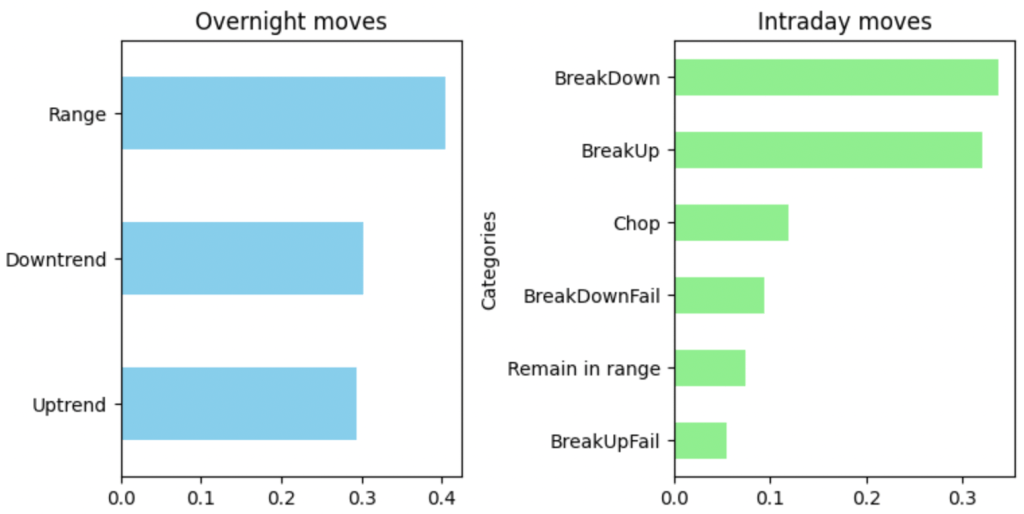
Above are the distributions of premarket (PM) and intraday (MH) price moves, respectively.
In the overnight session, fewer participants and wider bid-ask spreads means that price needs a smaller “push” to start moving in a direction after breaking news or other catalysts, but simultaneously lacks the volume needed to continue. In this sense, volume is a bit of a double edged sword.
This may also partly explain why the market spends most of its time in a range – the overnight session is the longer “half” of the day, and combined with the daily lull in volume around lunchtime, these periods might significantly contribute to the range statistic. This is just me thinking out loud, so take it with a large grain of salt as it hasn’t been tested. The fact that prices spend much time in a range is generally a “good” thing as far as market efficiency is concerned, because it means that prices are “agreed upon” most of the time.
According to the intraday distribution, the premarket range was broken on more than 65% of days (65.85%). More on this in a second, but first – I really like the visual below because of how clear it makes the connection between overnight and intraday price action:

The general pattern here is that intraday moves tend to follow in the same direction as the premarket move. This is sort of common sense, but I think the way it’s shown above is nicely intuitive. Breakdowns clearly become more likely if the market moved lower premarket, and vice-versa for upside breaks after upside moves premarket.
You could also interpret this by saying that trends tend to start overnight and persist into the next trading day, attributing it to the fact that most information is released during the overnight session.
It’s worth noting that overnight and intraday participants tend to “agree” on how catalysts affect price (bullish/ bearish), but the “true” impact of the information is not fully reflected in price until the intraday session. This is again attributable to lower overnight trading volume, which effectively causes an “understatement” of new information’s impact on price, which is later adjusted to a “correct” price by intraday participants.
Another interpretation is that overnight action creates a self-fulfilling risk profile in price, which participants from 9:30 onward do not tend to bet against. Basically, risk to reward for shorter-term intraday participants is set by premarket price action. When higher volume intraday participants can trade these opportunities, they move price in the same direction with greater magnitude.
Basically, trading against premarket moves has a lower expected value than betting on the existing trend at 9:30 (shown in the distributions above).
This brings me to a few ideas for strategies to exploit the relationship between overnight and intraday moves. These are barebones strategies I haven’t yet backtested, but do believe they are worth exploring further and can be profitable if implemented correctly.
*All of these strategies are meant to be be traded intraday
The simplest strategy is to simply go long above the premarket high and short below the premarket low, targeting a certain risk to reward. Not very glamorous, probably too difficult to refine to be worthwhile.
Another behavior to exploit is that intraday price action generally follows the premarket move. So you might go long or short off the open depending on the premarket trend, targeting the premarket high or low. The downside to this is that not every overnight session will have a trend to trade off of.
Instead of betting on an intraday move based on the premarket move, you could open a long straddle or strangle and close for profit at a specific percent outside of the premarket range. There are some difficulties with this in practice that might not make it worthwhile, but you never know for sure until you test.
To trade every day, you could open a short iron condor at the beginning of the intraday session, betting on a break of either side of the premarket range with strike prices at the premarket high and low. This removes the issue of correctly predicting which direction the market moves in, because max profit is reached as long as one side of the range is broken (65% of the time). The downside is that as long as price remains within the premarket range you’re losing money, but risk is capped so you can allocate a fixed portion of your capital and still run a profitable strategy, especially if you’re running it on a diverse set of names. This strategy would definitely benefit from being run on a portfolio of mostly uncorrelated symbols so you aren’t subjected to drawdowns when large portions of the market have lower volatility on some days.
A variation of the short iron condor idea could be to set strikes just inside the range instead of outside, since we know that either side is reached over 65% of the time. I’ll also add that the 65.85% range break statistic is technically understated, since in order to be considered a “break”, price had to break by a given percentage. This strategy accounts for both breaks of the range and when the range is touched but not broken.
Chop (a break of both sides of the premarket range) is very rare. This means if the range is broken on one side, we can bet fairly confidently that the other side will not be reached or broken. A simple strategy based on this might be to write puts or calls (covered or uncovered depending on preference/ risk tolerance), with strikes at the opposite side of the range when one side is broken. One of the major limiting factors of this is how wide the range is – the larger, the less premium you’ll collect. In super rare cases when both sides are broken, this might be an appropriate use case for a martingale betting strategy, doubling down on the opposite side of the range. Price would need to break both sides three times for this to cause a third loss, which is extremely unlikely to happen (It did not happen a single time over the tested period).
I’ll definitely be testing the last two strategies and sharing initial results with you in the earlier part of 2024.
If you made it this far, thanks for reading and Happy Holidays! I plan to make a couple more posts before the end of 2023. I also plan to post more often in 2024 than I did this year, so stay tuned!

Leave a comment